Visualization of operational monitoring data for the ATLAS experiment
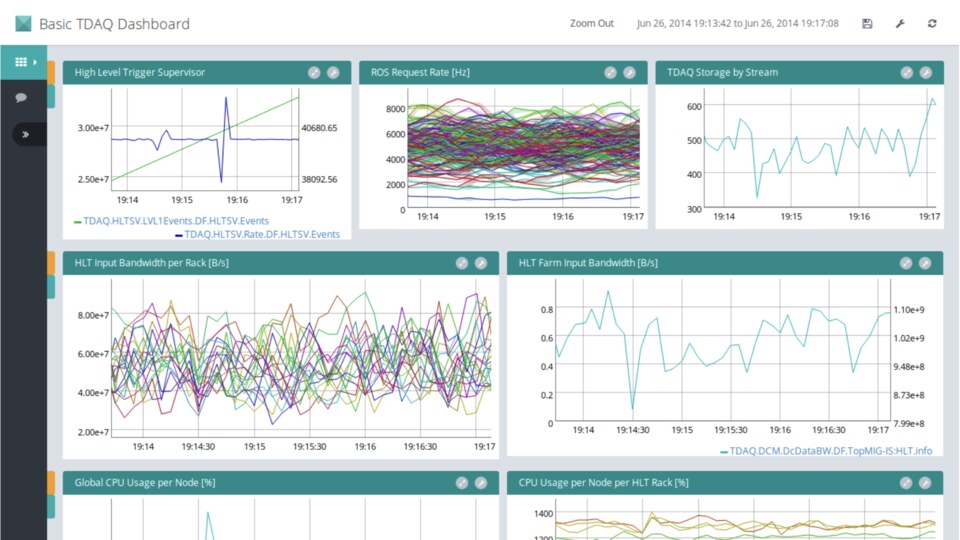
I built a data visualization system for the ATLAS experiment. My tool was designed to ingest 1M+ events per second and summarize them in dashboards to be used by experts. The goal was to replace Splunk which was ridiculously expensive. It was my EPFL Master thesis and received maximal grade. Last I checked it was still in use at CERN.